Understanding the Value of Financial Ratio Analysis
As Benjamin Franklin rightly said, “An investment in knowledge pays the best interest.” This could not be more accurate when it comes to the financial management of a business. To ensure sustainable business operations, it’s crucial to make sense of the company’s financial status. This is where financial ratio analysis comes into play. It allows business owners and stakeholders to understand their financial standing, compare performance against industry peers, and make informed decisions.
The Fundamental Ratios
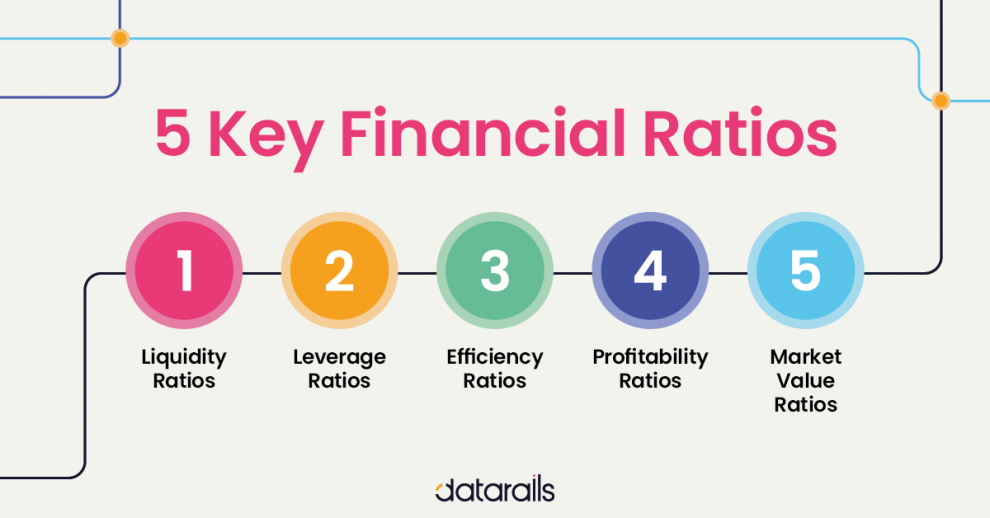
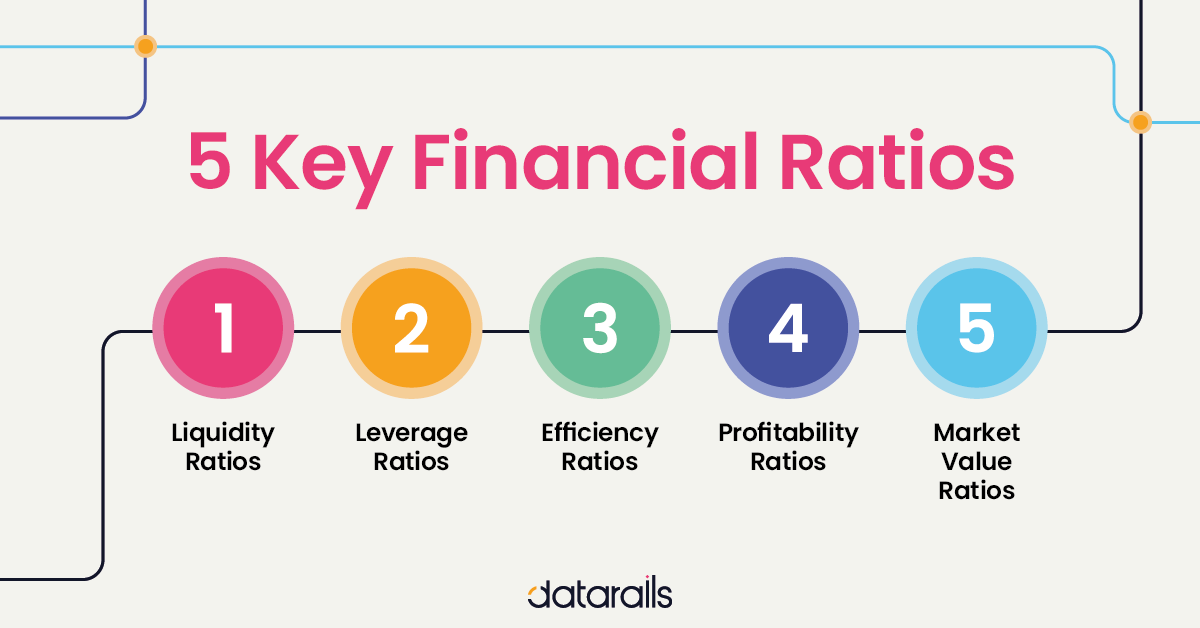
Financial ratios are essentially indicators of a company’s performance in different areas, and are typically classified into five types: liquidity ratios, solvency ratios, efficiency ratios, profitability ratios, and market prospect ratios. Here are a few of the most critical ratios within these categories:
- Liquidity Ratios such as Current Ratio (Current Assets / Current Liabilities) provide insights into a company’s ability to meet its short-term obligations.
- Solvency Ratios like Debt-to-Equity Ratio (Total Debt / Total Equity) show the company’s ability to meet its long-term obligations and its financial leverage.
- Efficiency Ratios like Inventory Turnover (Cost of Goods Sold / Average Inventory) measure how effectively a company uses its resources.
- Profitability Ratios like Return on Assets (Net Income / Total Assets) indicate how profitable a company is relative to its assets.
- Market Prospect Ratios such as Earnings Per Share (Net Income / Outstanding Shares) depict the earnings available to each shareholder and are often used by investors to assess the company’s future prospects.
Ratios in Practice: The Case of Amazon and Walmart
To illustrate the utility of financial ratios, let’s compare two retail giants: Amazon and Walmart. As of 2022, Walmart had a higher Current Ratio of 0.79 compared to Amazon’s 0.99, suggesting that Walmart might be slightly more capable of meeting its short-term liabilities.
On the other hand, Amazon’s Debt-to-Equity Ratio was 0.95, significantly lower than Walmart’s 1.49. This implies that Amazon has less risk associated with debt.
As for Efficiency, Walmart, with its vast network of physical stores, had an Inventory Turnover ratio of 9.2, much higher than Amazon’s 6.5, indicating superior inventory management.
Making Informed Decisions with Ratios
Business decisions should never be made on gut feelings or instincts. They need to be data-driven, and financial ratios provide that data. As Warren Buffet puts it, “Risk comes from not knowing what you’re doing.” By performing regular financial ratio analysis, you will gain a comprehensive understanding of your business’s financial health, making it easier to pinpoint problem areas, identify opportunities, and plan for the future.
The Future of Ratio Analysis: The Role of AI
Artificial Intelligence (AI) is playing an increasingly significant role in financial analysis. AI can automate the process of ratio analysis, enabling more frequent and detailed reviews, and providing real-time insights. Moreover, AI can use these ratios to predict future trends, allowing businesses to stay one step ahead.
As we move forward in the digital age, AI-driven ratio analysis will become the norm, providing businesses with unparalleled financial insights and ensuring they are equipped to navigate the increasingly complex business landscape.
To conclude, financial ratio analysis is an essential tool for businesses to understand their financial health and make well-informed decisions. As technology continues to evolve, we can expect the process of ratio analysis to become more streamlined and insightful, providing businesses with an even deeper understanding of their operations and financial health.


